Mr. Fourier, What is a good way to learn Fourier series?
Chapter 1: Creation of Waveform
In this chapter, we'll going to explore the concept of Fourier series and the way of visualizing a waveform at <canvas> element using JavaScript.
Cor
Fourier
First of all, let's start with a basic concept. What is called 「Fourier series」 is a idea that a complex wave is composed of simple waves, which is represented by the following formula:

where angular velocity w is 2 * pi * f; f stands for frequency. Since f = 1 / T, it is also possible to write w = 2 * pi / T; T stands for period.
Meanwhile, a0, an, bn is called 「Fourier coefficent」, and these can be calculated by the following formulas.


The principle of those formulas is simple.
First, please see a0. As you know, the amount of change is 0 when you integrate f(t) = sin(t) from 0 to 2pi, which is one period. It's because the area of + and - is equal. This will be same on f(t) = sin(2t), f(t) = cos(3t), etc, too. Meanwhile, as you can see from the Fourier series formula, a0 is a constant value. Thus, if you integrate a0 from 0 to one period, you can get the area. Therefore, if you divide this area by period T (let's think of T as a width of a rectangle), you will be able to get the a0 value (height).
an and bn are similar with a0. This is a fun fact that every wave has an amount of change of '0' if you integrate that wave multiplied by another wave (except oneself) from 0 to one period. What is more fun is that if you integrate a wave multiplied by itself from 0 to one period, the result is not 0; the area is an (or bn) * (T / 2). Thus, if you divide both sides by T / 2, you will get an and bn, the desired result.
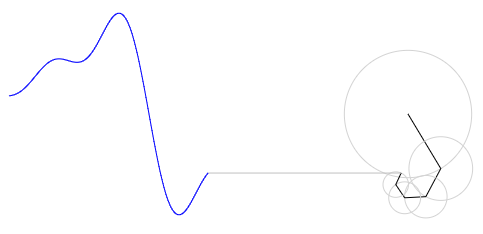
Now let's practice. But in this practice we'll not use the things we've just observed. Instead, we'll observe a waveform formed by lines rotating.
First, create a .html file and .js file and at html file, create a canvas element whose id is 'cvs'. After that, create a script element and connect the js file you've just created.
<!DOCTYPE html>
<html>
<head>
<meta charset="utf-8">
<title>Waveform Creation</title>
</head>
<body>
<canvas id="cvs" width="1000" height="800" style="border: 1px solid black;"></canvas>
<script src="The Name of JS file You've Just Created.js"></script>
</body>
</html>
Now let's write the js file. First, get the reference of the canvas element created in the html document.
const $cvs = document.getElementById('cvs');
const cctx = $cvs.getContext('2d');
Now declare variables for visualizing.
const offset = { x: 600, y: 200 }; // a center point of rotating lines
const waveformPosition = 400; // x coordinate where a waveform will be drawn
const scaler = 100; // constant value for scaling value up
const period = 300; // period
let deg = 0; // degree
// length of lines
const lines = [
    (1 / (-1 * Math.PI)),
    (1 / (2 * Math.PI)),
    (1 / (-3 * Math.PI)),
    (1 / (4 * Math.PI)),
    (1 / (-5 * Math.PI))
];
const path = []; // trace of waveform
const drawCount = 200; // a value determining how many traces to be drawn
Now, let's define draw(), a function draws a waveform in canvas element.
function draw() {
    window.requestAnimationFrame(draw); // It makes a waveform be drawn continuously

    cctx.clearRect(0, 0, $cvs.width, $cvs.height); // initialize

    const v = { x: 0, y: 0 }; // vector

    // create vectors by a number of lines
    for (let n = 0; n < lines.length; n++) {
        const radius = Math.abs(scaler * lines[n]);

        // circle
        cctx.beginPath();
        cctx.strokeStyle = 'lightgray';

        cctx.arc(offset.x + v.x, offset.y + v.y, radius, 0, 2 * Math.PI);
        cctx.stroke();

        // line
        cctx.beginPath();
        cctx.strokeStyle = 'black';

        cctx.moveTo(offset.x + v.x, offset.y + v.y);

        // (important) rotate lines
        // ※ Since n starts from 0, I did (n + 1) so that 1wt, 2wt can be represented.
        v.x += scaler * lines[n] * Math.cos((n + 1) * 2 * Math.PI * deg / period);
        v.y += scaler * lines[n] * Math.sin((n + 1) * 2 * Math.PI * deg / period);

        // By every call of draw(), draw a line to rotated position and the initial points of an next line is the final points of the last line.
        cctx.lineTo(offset.x + v.x, offset.y + v.y);

        cctx.stroke();
    }

    // a line drawing a waveform
    cctx.beginPath();
    cctx.strokeStyle = 'silver';

    cctx.moveTo(offset.x + v.x, offset.y + v.y);
    cctx.lineTo(waveformPosition, offset.y + v.y);

    cctx.stroke();

    // wave
    if (path.length === drawCount) {
        path.shift(); // it makes a waveform be drawned as much as drawCount
    }

    path.push({ x: waveformPosition, y: v.y });

    cctx.beginPath();
    cctx.strokeStyle = 'blue';

    for (let i = 0; i < path.length; i++) {
        if (i === 0) {
            cctx.moveTo(path[path.length - 1].x, offset.y + path[path.length - 1].y);
        } else {
            cctx.lineTo(path[path.length - 1 - i].x - i, offset.y + path[path.length - 1 - i].y);
        }
    }
    cctx.stroke();

    if (deg === period - 1) {
        deg = 0;
    } else {
        deg++;
    }
}

window.requestAnimationFrame(draw);
Not we are ready. If you execute the html file, you will see a waveform being drawned.
Have a fun with changing the value of variable lines and controlling n values inside of Math.sin(), Math.cos().
const lines = [
    (1 / (1 * Math.PI)),
    (1 / (3 * Math.PI)),
    (1 / (5 * Math.PI)),
    (1 / (7 * Math.PI)),
    (1 / (9 * Math.PI))
];

v.x += scaler * lines[n] * Math.cos((2 * n + 1) * 2 * Math.PI * deg / period);
v.y += scaler * lines[n] * Math.sin((2 * n + 1) * 2 * Math.PI * deg / period);