In this chapter, we'll going to explore the way of approximating actual waveform and the process of reproducing the approximated waveform into sound.
Cor
It is highly wonderful! Then is it possible to approximate actual wave?
Fourier
Yes indeed. This time let's approximate the wave of voice.
(If you don't have a microphone, please skip this step) write the below to the console. (no problem with just copying and pasting it)
if (navigator.mediaDevices) {
  console.log('possible to use getUserMedia);

  navigator.mediaDevices.getUserMedia({ audio: true, video: false })
    .then((stream) => {
      getUserMediaFlag = true;

      const AudioContext = window.AudioContext || window.webkitAudioContext;
      actx = new AudioContext({ sampleRate: 44100 });
      const source = new MediaStreamAudioSourceNode(actx, { mediaStream: stream });
      analyser = new AnalyserNode(actx, { fftSize: 1024, maxDecibels: -30, minDecibels: -100, smoothingTimeConstant: 0.8 });

      source.connect(analyser);

      dataSize = analyser.frequencyBinCount;
      audioData = new Uint8Array(dataSize);

      window.requestAnimationFrame(showVoice);
    })
    .catch((err) => {
      console.log('error occurred during getUserMedia');
    });
} else {
  console.log('getUserMedia not supported');
}
code explanation (see if you are interested)
It is a code that gets microphone authorization and in case of success, send the microphone data to sound analyser.
Then a popup window will show up. We need to take voice wave, so you have to accept it.
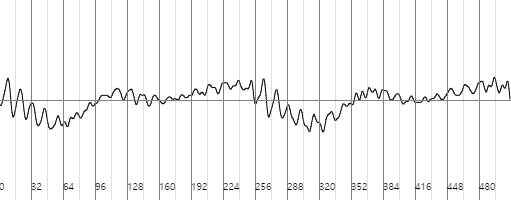
...Then a waveform will appear to the below canvas element.
Choose one vowel among a, e, i, o, u. Keep pronouncing it, click the 'get data and check' button above. Try this process until you can see an exact 'one period of the waveform' at the below canvas element.
※ Note: You can see the voice data by typing console.log(takenAudioData) to the console window.
After that, eye-estimate where is the starting point of a waveform and where is the end point, and type the below to the console window.
sliceFrom = 0; // ← delete this number and input the staring point of period
sliceTo = 256; // ← delete this number and input the end point of period
const sliced = takenAudioData.slice(sliceFrom, sliceTo);
const refined = [];

for (let i = 0; i < sliced.length; i++) {
  refined[i] = (sliced[i] / 128) - 1;
}
code explanation (see if you are interested)
This code slices a part where we need from the whole waveform data, and let the data be in range of [-1, 1).
By this processes, we finally get the data we are going to approximate.
Now type the below to the console window and find Fourier coefficients. You'll see codes which calculate Fourier coefficients in the next chapter, so please look forward to!
Now everything is done. Type the below command to the console window and check how will the approximated wave be.
approxWave(coef);
Cor
How that can be! It is so similar with the original waveform!
Fourier
Haha this is the power of Fourier series.
Now type the below to the console window...
const audioBuffer = new AudioBuffer({ numberOfChannels: 1, length: 1000 * refined.length, sampleRate: actx.sampleRate });

const buffering = audioBuffer.getChannelData(0);
let count = 0;

for (let i = 0; i < audioBuffer.length; i++) {
  buffering[i] = refined[count];

  if (count === refined.length - 1) {
    count = 0;
  } else {
    count++;
  }
}

function play() {
  const absn = new AudioBufferSourceNode(actx, { buffer: audioBuffer });

  absn.connect(analyser)
      .connect(actx.destination);

  absn.start();
}

play();
window.requestAnimationFrame(showReproducedVoice);
... Are you surprised by the sudden sound? This is the reproduced wave of the approximated wave (the sound that you pronounced at the above).
Meanwhile somehow the reproduced sound sounds like a musical tone! I think the reason is as follows:
Actually the taken data is a waveform having length of (data length) * 1 / 44100 (sec.). Since that length is one period, divide 1 with that length results in frequency. For example, 256 * 1 / 44100 is 0.0058. The reciprocal of it is 172.4138 (Hz).
Meanwhile the frequenct of A4 (octave 4 la) is 440Hz. Since one scale consists of 12 notes and every one octave, frequency doubles, so A3 is 220Hz. 4 notes below la is fa. Therefore the frequency of this fa is 220 * 2^(-4 / 12) = 174.6141 (Hz).
172 and 174 is quite close! Isn't it the reason that the taken waveform sounds like a musical tone?
Anyway, so far so interesting. But the following chapters are more fun. Let's step forward, saying 「Fourier series 'expansion'」.